|
A NEW APPROACH TO CREATIVE ERFUMERY |
Introduction
A perfumer combines dozens of aromas by trial and error to create a new compound. Since Jean Carles proposed "Carles' method" in 1961 [1], no new systematic method of combining aromas to a ratio has been proposed. If we can find common structure of good perfumes, it should be possible for us to use this structure to create new fragrances. The purpose of this paper is to report a finding, which can be used in creative perfumery. In this work, gas chromatographic data for 36 successful fragrances marketed around the world were first analyzed.
1. GC and GC/MS Analysis
Table 1. shows 36 sample fragrances selected to provide a reasonable spread of fragrance types such as bouquet, chypre and oriental. The ingredient data was obtained by gas chromatography, using a carbowax-type polar column, while the ingredient data showing very small peaks were neglected.
Table-1 Sample Fragrance
| No, |
Code |
Odor Type |
No, |
Code |
Odor Type |
No, |
Code |
Oaor Type |
No, |
Code |
Odor Type |
| 1 |
GIOR |
Bouquet Floral |
10 |
HITS |
Chypre Fruity |
19 |
DSIM |
Bouquet Fresh |
28 |
CHO5 |
Bouquet Aldehyde |
| 2 |
PARI |
Bouquet Floral |
ll |
YSAT |
Chypre Animal |
20 |
ANAI |
Bouquet Fresh |
29 |
CALA |
Bouquet Aldehyde |
| 3 |
LAIR |
Bouquet Floral |
12 |
OPIU |
Oriental Spicy |
21 |
LILI |
Bouquet Fresh |
30 |
CALE |
Bouquet Aldehyde |
| 4 |
NIAN | Bouquet Floral |
13 |
SAMS |
Oriental Ambery |
22 |
LOUL |
Bouquet Sweet |
31 |
TRES |
Bouquet Floral |
| 5 |
FIDJ |
Bouquet Floral |
14 |
OBSE |
Oriental Antbery |
23 |
BEAU |
Bouquet Green |
32 |
BOUC |
Bouquet Sweet |
| 6 |
ETER |
Bouquet Floral |
15 |
COCO |
Oriental Spicy |
24 |
KNOW |
Chypre Floral |
33 |
CHAR |
Bouquet Floral |
| 7 |
LIZC |
Bouquet Fruity |
16 |
JOIY |
Bouquet Floral |
25 |
EDG I |
Bouquet Fruity |
34 |
CO93 |
Bouquet Green |
| 8 |
MISD |
Chypre Animal |
17 |
MILL |
Bouquet Floral |
26 |
CALY |
Bouquet Fruity |
35 |
CHI9 |
Bouquet Green |
| 9 |
CABO |
Chypre Animal |
18 |
NAHE |
Bouquet Floral |
27 |
ASHl |
Bouquet Fruity |
36 |
CO92 |
Bouquet Fruity |
2. Data Analysis
|
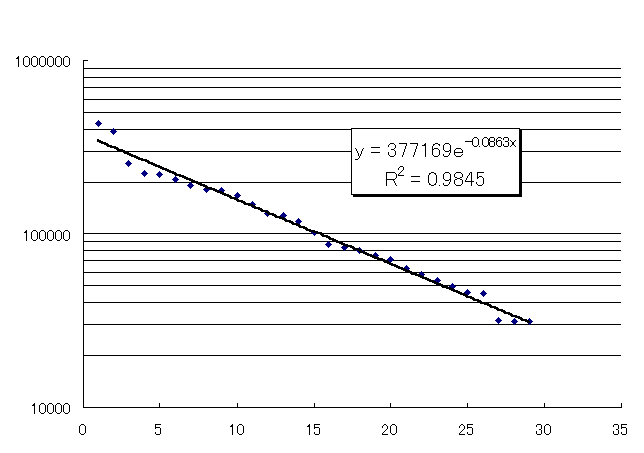
In order to examine the distribution of the ingredients, the relative concentrations and their rankings were plotted on a semi-logarithmic graph. A typical result is given in Figure 1. In all cases, the best fit of the data is represented by a straight line with negative slope. The equation of regressiontrendline is given below. Y=ae-bx (or Y=a/exp(bX) ) (1) |
where Y is the concentration, X is the ranking, a and b are the constants
Fig-1 Semi-logarithmic Graph(case of GIOR)

| Rank. | Ingredients | Conc. | Rank. | Ingredients | Conc. | Rank. | Ingredients | Conc. |
| 1 | Diethyl phthalate | 432575 | 11 | Hydroxycitronellal diethyl acetal | 147999 | 21 | Benzyl salicylate | 62935 |
| 2 | Benzyl acetate | 391380 | 12 | Helional | 132606 | 22 | Dipro | 57966 |
| 3 | Iso-E-super | 257459 | 13 | Linalool | 128280 | 23 | Iso-E-super | 53570 |
| 4 | ƒ¿-n-Amyl cinnamic aldehyde | 223337 | 14 | Linalyl acetate | 119223 | 24 | Geranyl acetate | 49685 |
| 5 | Phenyl ethyl alcohol | 220596 | 15 | Benzyl benzoate | 100961 | 25 | Iso-E-super | 45591 |
| 6 | Methyl anthranilate | 208154 | 16 | Lilial | 86240 | 26 | L.R.T.17 | 45134 |
| 7 | Hydroxycitronellal | 190034 | 17 | Citronellol | 83399 | 27 | iso-Propyl myristate | 31658 |
| 8 | Hedione | 180293 | 18 | Geraniol | 80172 | 28 | Hexadecane | 28741 |
| 9 | Styrallyl acetate | 179345 | 19 | d-Limonene | 74839 | 29 | Lyral | 26256 |
| 10 | Hexyl cinnamic aldehyde | 166777 | 20 | Cinnamic alcohol | 70611 | 30 | Musk ketone | 24486 |
Table 2. shows the constants(a), (b) and R-squared values(R^2); characteristics of a fragrance prescription must appear in these values of (b) and (R^2). The (b) values of MITS and DSIM are much larger than those of the other fragrances. With a larger coefficient (b), which then gives a steep slope on the graph due to a marked change in the ingredients, these special two fragrances have a simple and dynamic composition. R-squared value shows the reliability of the trend line. The minimum value for CALY is 0.88, therefore, the fit of the data to eq. (1) is excellent.
Table-2 constants(a)(b) and R-squared value
| Regression equation Y=a/exp(bx) |
| No, |
Code |
a |
b |
R2 |
No, |
Code |
a |
b |
R2 |
No, |
Code |
a |
b |
R2 |
| 1 |
GIOR |
765475 |
0.1386 |
0.9793 |
13 |
SAMS |
575295 |
0.1296 |
0.9787 |
25 |
EDGI |
197569 |
0.1588 |
0.9796 |
| 2 |
PARI |
575329 |
0.1554 |
0.9852 |
14 |
OBSE |
564637 |
0.1596 |
0.9699 |
26 |
CALY |
1.00E+06 |
0.1673 |
0.8833 |
| 3 |
LAIR |
733011 |
0.1651 |
0.9555 |
15 |
COCO | 468331 |
0.1366 |
0.9848 |
27 |
ASHl |
667124 |
0.1587 |
0.9725 |
| 4 |
NIAN |
144591 |
0.1222 |
0.9527 |
16 |
JOIY |
1.00E+06 |
0.1612 |
0.9740 |
28 |
CHO5 |
263954 |
0.1570 |
0.9872 |
| 5 |
FIDJ |
565976 |
0.1419 |
0.9768 |
17 |
MILL |
381495 |
0.1065 |
0.9496 |
29 |
CALA |
195828 |
0.1325 |
0.9557 |
| 6 |
ETER |
1.00E+06 |
0.1666 |
0.9861 |
18 |
NAHE |
492298 |
0.1275 |
0.9432 |
30 |
CALE |
473573 |
0.1302 |
0.9910 |
| 7 |
LIZC |
1.00E+06 |
0.1240 |
0.9666 |
19 |
DSIM |
777798 |
0.1990 |
0.9215 |
31 |
TRES |
661189 |
0.1443 |
0.9177 |
| 8 |
MISD |
598474 |
0.0961 |
0.9492 |
20 |
ANAI |
474021 |
0.1086 |
0.9862 |
32 |
BOUC |
337421 |
0.1324 |
0.9849 |
| 9 |
CABO |
222091 |
0.1341 |
0.9838 |
21 |
LILI |
673493 |
0.1204 |
0.9862 |
33 |
CHAR |
117832 |
0.1155 |
0.9151 |
| 10 |
MITS |
168860 |
0.2403 |
0.9764 |
22 |
LOUL |
432084 |
0.1457 |
0.9770 |
34 |
CO93 |
386759 |
0.1611 |
0.9763 |
| ll |
YSAT |
1.00E+06 |
0.1324 |
0.9865 |
23 |
BEAU |
671798 |
0.1175 |
0.9813 |
35 |
CHI9 |
130717 |
0.1211 |
0.9306 |
| 12 |
OPIU |
1.00E+06 |
0.1283 |
0.9804 |
24 |
KNOW |
590172 |
0.0874 |
0.9753 |
36 |
CO92 |
294815 |
0.1468 |
0.9576 |
|
3. A Study on the Essential oils |
A perfume is an artificial odor. A typical example of an exponential relationship in nature is the half-life data for radioactive substances. We analyzed several data reported in Perfumer & Flavorist by Dr.BrianM.Lawrence[2]. The results shown in Figure2. and Table 3. clearly indicate that the perfumes have a structure similar to natural oils. Do perfumers unconsciously follow the rule of nature?
Fig-2 Semi-logarithmic Graph (case of Jasmin oil)

Table-3 Coefficients and R-squared Values of Natural Oils
| Essential OiIs |
(-b) |
R^2 |
| Jasmin |
-0.1958 | 0.9608 |
| Rose |
-0.1565 | 0.9106 |
| Ylang Ylang |
-0.0945 | 0.9257 |
| Lavender |
-0.0799 | 0.9237 |
| Patchouli |
-0.3003 | 0.8832 |
4. "Golden Sequence of Numbers
Our data show that the quantity of components arranged in descending order fit the sequence of numbers obtained from the exponential equation without exception. Therefore, our discovery suggests that the sequence of numbers can be applied to facilitate fragrance creation. If we associate odorants with these numbers, it may be possible to obtain an aesthetically pleasing fragrance; the number might be called the "Golden Sequence of Numbers (hereafter cited as GSN)" like the "Golden Section" which is a universal beauty proportion found in nature.
5. Factor Analysis
In using GSN for determining the composition of a fragrance, one problem is to decide which odorant should be associated with which number. A factor analysis was then applied to find a clue to placing the odorants. In this analysis, 34 significant aroma chemicals, generally used in fragrances, were regarded as variables. There are 36 samples (cases); 34*36 data matrix becomes an object of the analysis. Factor analysis is a tool that multi-dimensional data are converted into a small-dimensional data using few factors. If the ingredients of fragrance have not been selected at random, and have been set up as the clusters, the clusters could be extracted as the factors. Table 4. shows a varimax-rotated (Interpretation of factor becomes easy by the rotation ) factor matrix. In Table 4., it is seen that each factor corresponds to general odor classification of aroma chemicals; i.e., factors 1, 2,3,4,5 and 6 are identified as fresh note, rose note, jasmin note, floral note, woody-musky note, and sweet note, respectively.
Table-4 Factor Matrix (varimax-rotated)
| variables |
Factor1 |
Factor2 |
Factor3 |
Factor4 |
Factor5 |
Factor6 |
| Linalyl P.A. |
0.89 | 0.13 |
-0.10 |
-0.12 |
0.01 |
0.01 |
| Llnalool |
0.80 | 0.01 |
0.14 |
0.06 |
0.08 |
0.36 |
| Hyd.CitD.A |
0.74 | 0.07 |
0.01 |
0.02 |
0.34 |
-0.10 |
| Citronellol |
-0.06 |
0.91 | 0.09 |
-0.05 |
-0.ll |
-0.03 |
| Rose P |
0.02 |
0.84 | 0.07 |
-0.1 5 |
0.12 |
-0.18 |
| Ben. Sail. |
0.01 |
0.06 |
0.82 | 0.00 |
-0.ll |
-0.01 |
| LRT 17 |
0.04 |
-0.13 |
0.75 | 0.35 |
0.03 |
-0.04 |
| Eugene! |
-0.06 |
0.10 |
0.74 | -0.17 |
0.03 |
0.12 |
| Helional |
0.02 |
-0.04 |
-0.02 |
0.89 | -0.01 |
-0.14 |
| Lilial |
-0.04 |
-0.07 |
0.15 |
0.79 | 0.16 |
-0.10 |
| Musk T |
0.ll |
-0.05 |
-0.10 |
0.18 |
0.92 | -0.02 |
| Veti. Ace. |
0.08 |
-0,04 |
0.03 |
-0.06 |
0.90 | -0.1 2 |
| Vanillin |
0.02 |
0.03 |
0.00 |
-0.07 |
0.06 |
0.84 |
| Coumatin |
0.21 |
-0.ll |
-0.05 |
-0.19 |
-0.15 |
0.81 |
| Limonene |
-0.04 |
-0.17 |
0.36 |
0.10 |
-0.13 |
0.71 |
6. Study of the Transformed data
Figure 3. shows a plot of the log of the summed concentrations for every class versus its rankings. A linear relationship was found as mentioned before for the single-odorant-level. This reminds us of a "fractar(self.resemblance structure) in that, irrespective of odorant-level, similar results demonstrating a linear line on a semi-logarithmic graph were found. The result of factor analysis provided a clue on how to associate aroma to GSN. Instead of assigning aroma to each number of GSN, we found it better to group GSN into clusters and associate them with notes. We can obtain the third geometrical progression by adding two individual geometrical progressions. Therefore, we can create fragrances by connecting several; bases individually fitting the exponential equation, hi this way, the bases can be used advantageously to achieve good harmony systematically. It has been described that the compositions of natural essential oils were expressed by exponential equation. Viewed in this light, these odorants can be regarded as a preblended base.
Fig-3 Semi-logarithmic Graph (classification level)

| Rank. | Class. | Conc. | Rank. | Class. | Conc. |
| 1 | JASM | 1213213 | 7 | GREN | 204568 |
| 2 | Fix | 905253 | 8 | SWET | 127944 |
| 3 | FLOR | 685878 | 9 | MUSK | 43094 |
| 4 | ROSE | 525904 | 10 | SPIC | 16899 |
| 5 | WOOD | 525105 | 11 | VANI | 15446 |
| 6 | FRES | 351528 |
7. Procedure of Perfumery
|
The results of the factor analysis gave us an idea of what odorants to consider
and how to place them on the GSN. Let us now look at a summarized procedure. |
|
BASE 1 |
BASE 2 |
BASE 3 |
BASE 4 |
BASE 5 |
BASE 6 |
Column- |
|
|
AROMA 1 |
85.2 |
72.6 |
61.9 |
52.7 |
44.9 |
38.3 |
63.1 |
|
AROMA 2 |
32.6 |
27.8 |
23.7 |
20.2 |
17.2 |
14.7 |
24.2 |
|
AROMA 3 |
12.5 |
10.6 |
9.1 |
7.7 |
6.6 |
5.6 |
9.2 |
|
AROMA 4 |
4.8 |
4.1 |
3.5 |
3.0 |
2.5 |
2.1 |
3.5 |
|
Row-ompositionO |
24.0 |
20,4 |
17.4 |
14.8 |
12.6 |
10.8 |
100.0 |
Step 4. To place aroma chemicals
|
BASE 1 |
BASE 2 |
BASE 3 |
BASE 4 |
BASE 5 |
BASE 6 |
|
|
AROMA 1 |
hedione |
demethyl P.E.C. |
lnalyl acetate |
galaxol ide 50 |
lyral |
benzy l benzoaie |
|
AROMA 2 |
awl cin.ald. |
dhydro nyrce. |
linalool |
vertofix cou |
lilial |
cinnamyl ace. |
|
AROMA 3 |
benzyl acetate |
dmethyl B.C.A. |
d-1imonene |
i so-E-SLpe r |
cis-3-hex.sal i. |
heliotrepine |
|
AROMA 4 |
hexyl cin. aid. |
styral lyl ace. |
aldehyde c-9 |
bacdanol |
a-terpi neol |
vanllin |
|
Step 5. Mixing |
8. Application
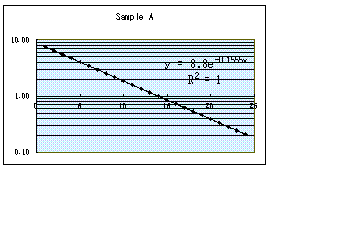
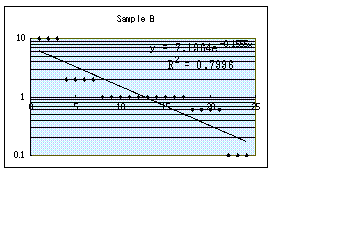
In order to check availability of the method developed, we made two compounds having the same value of coefficient (b); but one of them (sample A) just fit to GSN (R-squared value is 1.00) and the other (sample B) had small R-squared value (O.SO). Figure 4. and 5. are graphically showing for these samples. If it can be proven that sample A has aesthetically appropriate identity than sample B, using GSN to create a fragrance becomes useful. Subjective sensory information about [which of the samples were well-balanced?] was obtained from twenty-three perfumers. Sample A was preferred by nineteen perfumers, which was much higher than that of sample B which was 4 perfumers (l% significant difference).
Fig-4 Conc.-Rank.Graph for Sample A.

Fig-5 Conc.-Rank. Graph for Smple B

Conclusions
It surprises us that all the successful fragrance discovered by intuition and experiences have similar structure of composition, which is also found in natural essential oils. It has been shown that even the person who has little of talent or experience can create superior work by this method that utilized this construction. But perfumery is the art of creating pleasurable and meaningful odor. As always in perfumery, the perfumer must ultimately be guided by his experience and aesthetic judgment. The method is to be used, as a guide rather than to impose a fixed method of work.
Acknowledgments
We would like to thank perfumers of Soda Aromatic co.; LTD. for evaluating the application samples.
References
[1] Carles,J. Une methode de creation en pariumerie,Recherches, Dec 1961. English transl. A Method of Creation inPerfumery,Soap Perf, Cosm. 35:328-335(1962)[2] Lawrence,B.M.,Progress in Essential Oils, Perfumer & Flavorist,vol.16-20